
Environmental Sustainability
Roadmap to 2050
Aviation accounts for roughly 3% of global GHG emissions, a share expected to rise as demand grows.Footnote 1 The pace of progress on the journey to reduce GHG emissions is slow. Aircraft remain in service for decades, SAF remains limited and expensive, and infrastructure development takes time. As we work toward our long-term goal, we are focused on mitigating our emissions using the levers under our direct control or influence. These levers of our illustrative roadmap include optimizing our fleet, ramping up the use of SAF and embedding sustainability throughout our operations.
Our GHG emissions and carbon footprint in 2025Footnote 2


Pie graph depicting how emissions are broken down into Scope 1, 2, and 3 emissions.
- Scope 1 at 73%
- Scope 2 at <1%
- Scope 3 at 27%
How we measure our GHG emissions
Our reporting methodology aligns with the Greenhouse Gas Protocol’s guidance for corporate best practices in GHG accounting. This supports greater transparency and comparability of the GHG emissions resulting from conventional jet fuel, SAF and our other emissions sources.
Our 2025 GHG footprint incorporates emissions from both conventional jet fuel production and combustion, referred to as well-to-wake (WTW) emissions. This methodology captures the full lifecycle emissions of jet fuel usage and allows us to chart both Scope 1 and associated Scope 3 emissions reductions from the replacement of conventional jet fuel with SAF.
Our 2035 near-term carbon emissions reduction goal was validated by the Science Based Targets initiative (SBTi). This independent verification signifies that our goal aligns with climate science and is considered ambitious enough to align with the goal of limiting global warming to well below 2.0°C.Footnote 3
2025 well-to-wake net emissions split
SAF reduces both segments, replacing conventional jet fuel cuts Well-to-tank (WTT) and Tank-to-wake (TTW) emissions together.
- 20% WTT (fuel production)
- 80% TTW (fuel used by aircraft)
Gross GHG emissions vs. intensity over time


This graph represents emissions intensity vs. carbon intensity and absolute emissions vs. gross GHG emissions. The dark green bar on this graph represents our gross GHG emissions from 2019 to 2025, which has gone up in recent years due to growth, while the green line represents our emissions intensity, which is lowering as years progress.
Key insight
Our overall absolute emissions have increased in recent years, including 2025, and are expected to continue to increase in the short term due to business growth and the limited supply of sustainable alternatives, such as SAF. Our emissions intensity per revenue tonne-kilometers (RTKs) increased in 2025 compared to 2024 by 0.3%.
However, our emissions intensity decreased in 2025 by 13.5% compared to our 2019 baseline, in part due to our use of newer, more energy-efficient aircraft and increased load factors as demand for travel increased.Footnote 4
Illustrative decarbonization roadmapFootnote 5
This illustrative roadmap outlines a potential pathway for United to achieve net-zero emissions by 2050 based on several assumptions and hypothetical scenarios. Our roadmap includes upstream indirect emissions from jet fuel production; i.e., WTW emissions accounting, which covers the full lifecycle of conventional jet fuel production. This roadmap is an illustrative forecast for achieving net zero based on a society-wide energy transition scenario — and may change as the underlying scenarios and assumptions evolve.


This is a wedge chart that shows what United’s total GHG emissions would be in 2050 if we did nothing to address our carbon footprint.
- Fleet renewal: 20.4%
- Future AC technology: 7.5%
- Operational efficiency: 3.5%
- Alternate propulsion: 1.1%
- Today’s commercial SAF: 18.7%
- 2nd generation SAF: 29.5%
- 3rd generation SAF and carbon removals: 19.3%
This is a wedge chart that shows what our total GHG emissions would be in 2050 if we continued with business as usual and did nothing to address our carbon footprint. Each color represents a different type of action, or lever, we can potentially take to reduce our carbon footprint. These levers include fleet renewal, future aircraft (AC) technology, operational efficiency, alternate propulsion, today’s commercial SAF, second-generation SAF, and third-generation SAF and carbon removals. We also represent with a black line what our emissions could look like if we continue with business as usual, as well as a green dashed line to show our target emissions. All summed up, these levers could reduce our footprint to net-zero emissions in 2050. The sections below detail each lever and its estimated impact.

This is a separated-out portion of the Decarbonization Roadmap that represents how through our fleet renewal, future AC technology, better operational efficiency and alternate propulsion, we’ll be lowering our emissions over time. These levers are represented in dark blue for fleet renewal, blue for future AC technology, purple for operational efficiency, yellow for alternate propulsion.
- Fleet renewal: 20.4%
- Future AC technology: 7.5%
- Operational efficiency: 3.5%
- Alternate propulsion: 1.1%
Click image to enlarge
Drive fuel efficiencies and innovation in flight
We begin with the fundamentals: renewing our fleet with more efficient aircraft that reduce conventional jet fuel use and emissions. We will also look to adopt future aircraft technologies, which could continue to drive further fuel efficiency. Building on that foundation, we are enhancing operational efficiencies and investing in alternate propulsion systems to further reduce our reliance on conventional jet fuel.
This is a separated-out portion of the Decarbonization Roadmap that represents how through supporting scaling, commercializing and adopting SAF within aviation, we’ll be lowering our emissions over time. These levers are represented in light green for today’s commercial SAF, green for second generation SAF and dark green for third generation SAF.
- Today’s commercial SAF: 18.7%
- 2nd generation SAF: 29.5%
- 3rd generation SAF and carbon removals: 19.3%
Click image to enlarge
20.4% - Fleet renewal
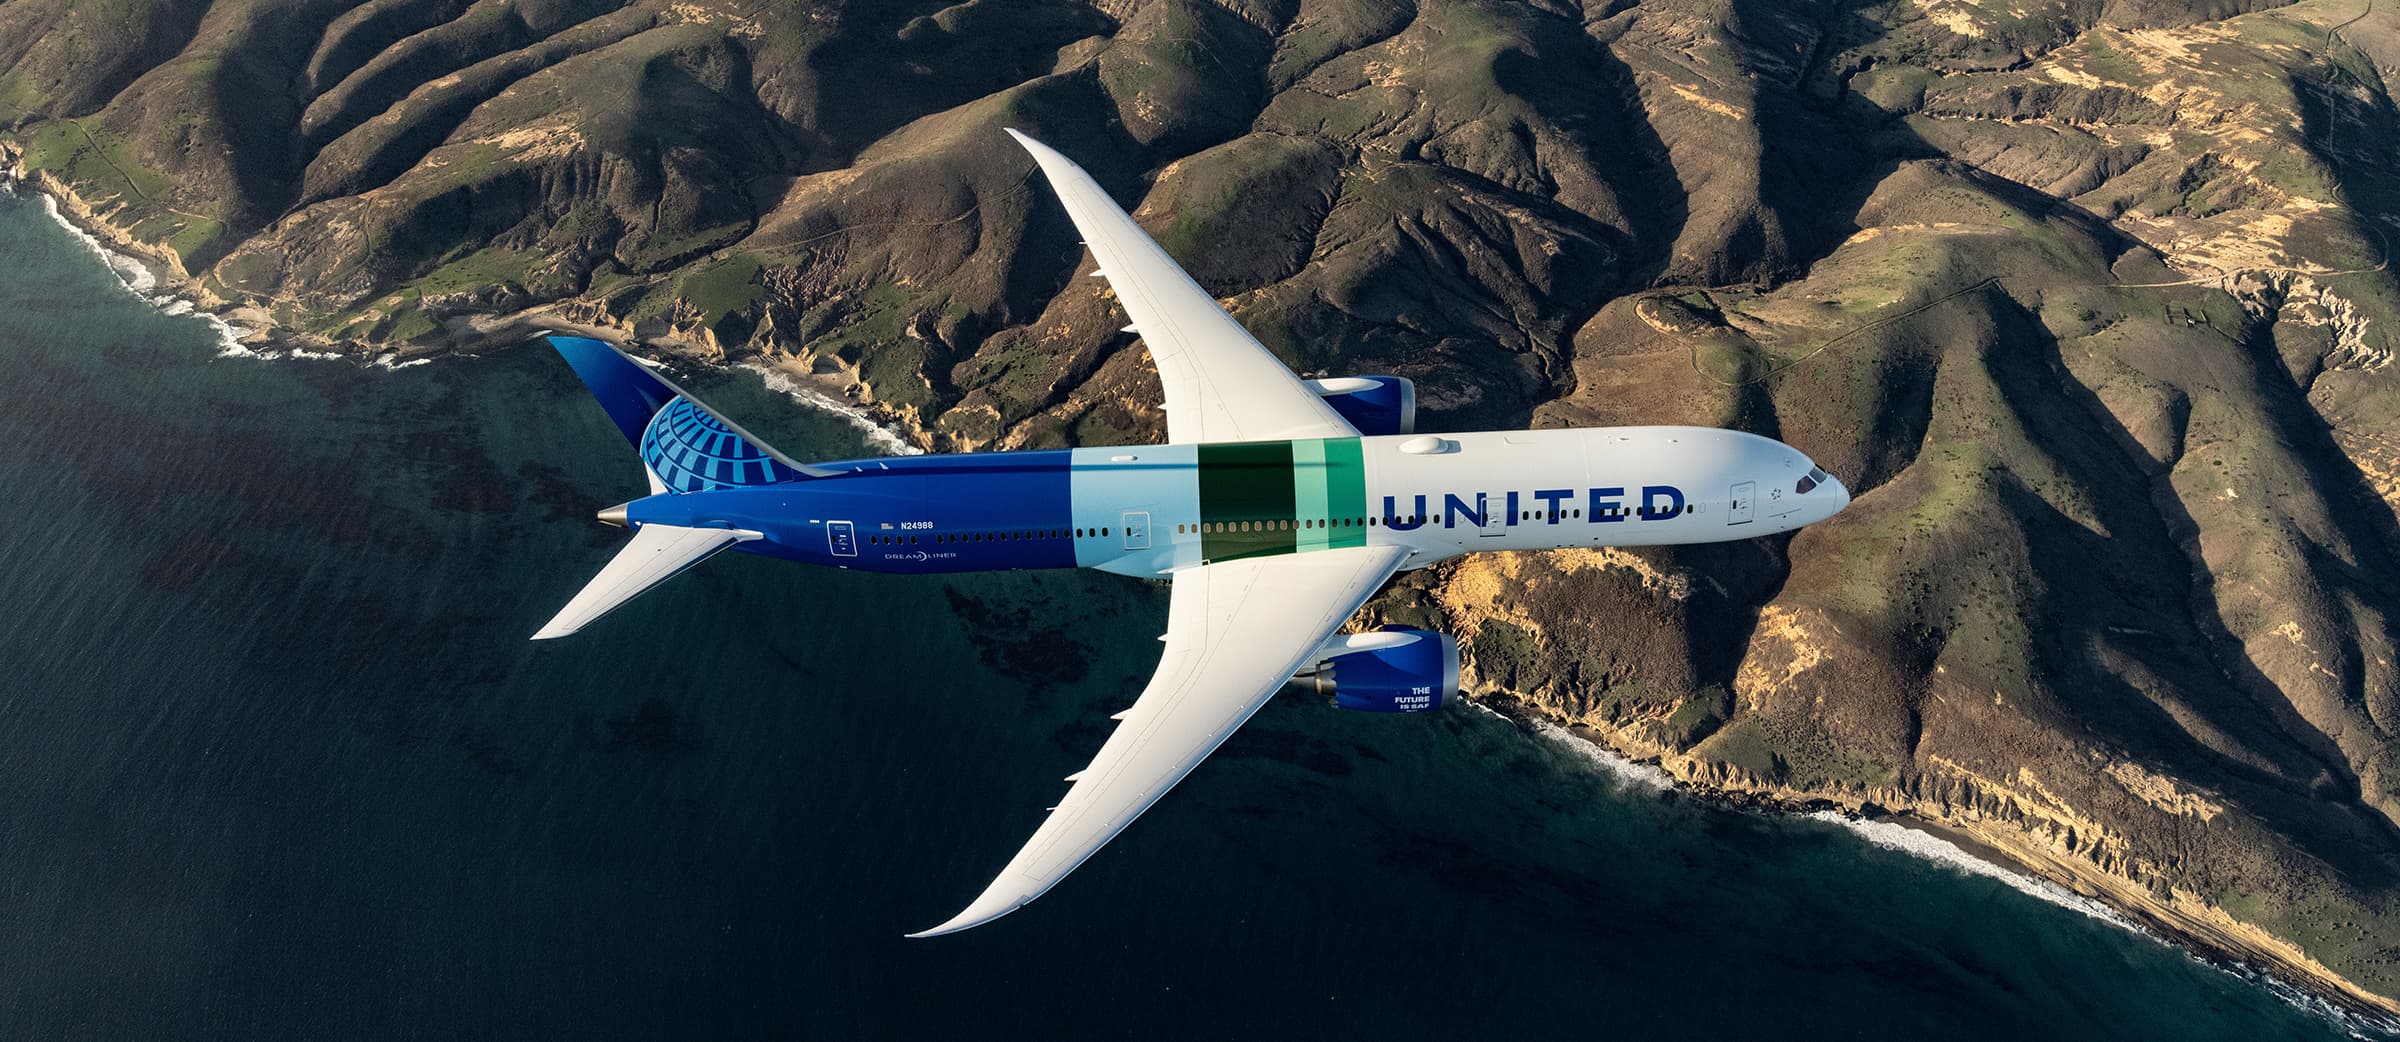
In 2021, United announced United Next, a historic order for the newest aircraft models, which is expected to increase the total number of available seats per domestic departure by almost 30%, significantly lowering carbon emissions per seat. Subject to the ability of aircraft manufacturers to deliver the ordered aircraft on schedule, United expects to take delivery of over 630 new narrowbody and widebody aircraft by the end of 2034, with an expected 20% improved fuel efficiency per seat compared to older planes.Footnote 6
United took delivery of 88 new planes in 2025 and plans to take delivery of 131 new planes in 2026. Based on our current fleet renewal plan and our updated fuel burn model, the new, more efficient aircraft, combined with fuel efficiency measures related to seat density, would result in 20.4% of our forecasted emissions reductions by 2050.Footnote 7
7.5% - Future aircraft technology
Advancements in aircraft design and engine technology often support improvements in fuel efficiency, though we recognize much of this innovation rests with manufacturers and is outside our direct control. Our illustrative roadmap shows the potential benefits of several possible advancements — new engines, more aerodynamic airframe designs and future generation aircraft models that are currently in the design phase.Footnote 8
Our estimate is that by 2050, future generation aircraft could be up to 30% more fuel efficient than today’s commercial fleet.Footnote 9 Additionally, we will rely on manufacturers to develop efficient technologies that we may be able to retrofit onto existing aircraft, improving fleetwide fuel efficiency up to 1.5% every five years.Footnote 10 We expect this lever to contribute approximately 7.5% of the reductions needed to reduce our business-as-usual emissions to zero, a decrease of 2% from last year’s projection due to changes in expectations of future fleet composition and manufacturer technology.Footnote 11
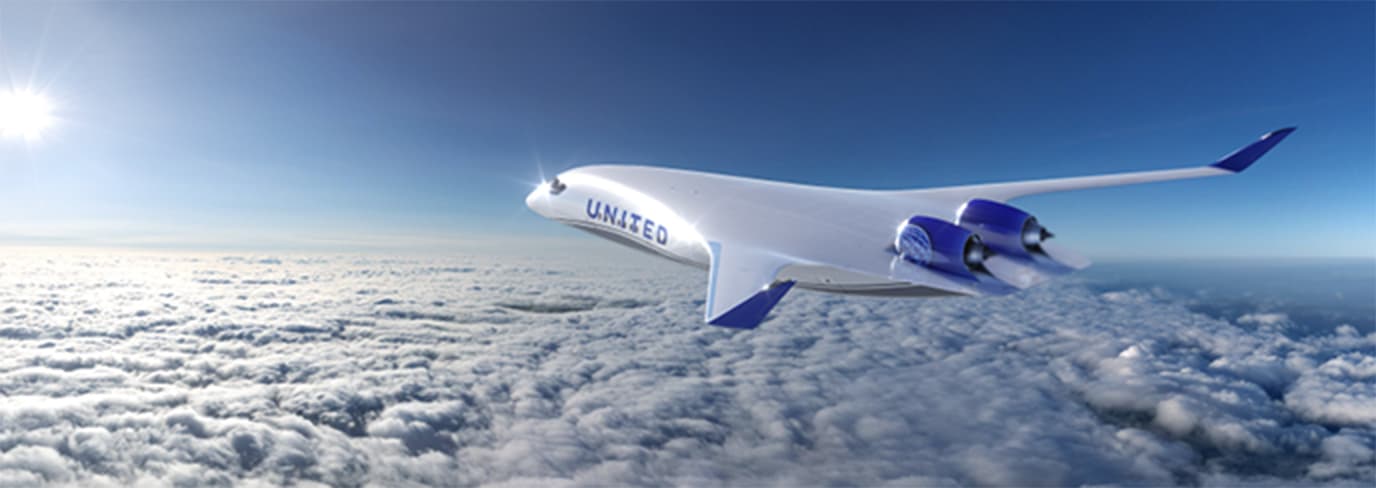
A JetZero plane flying above the clouds
In 2025, United announced an investment in JetZero, a start-up developing the world’s first commercial blended wing body aircraft.Footnote 12 The investment includes a path to order up to 100 airplanes, with an option for an additional 100. The design reduces drag and produces lift across the entire wingspan — which could result in up to a 50% reduction in fuel burn per passenger mile compared with similarly sized aircraft. The aircraft’s configuration also has the potential to enhance the passenger experience through flexible seating layouts, larger seats across all cabins and dedicated overhead bin space for each seat.
3.5% - Operational efficiency
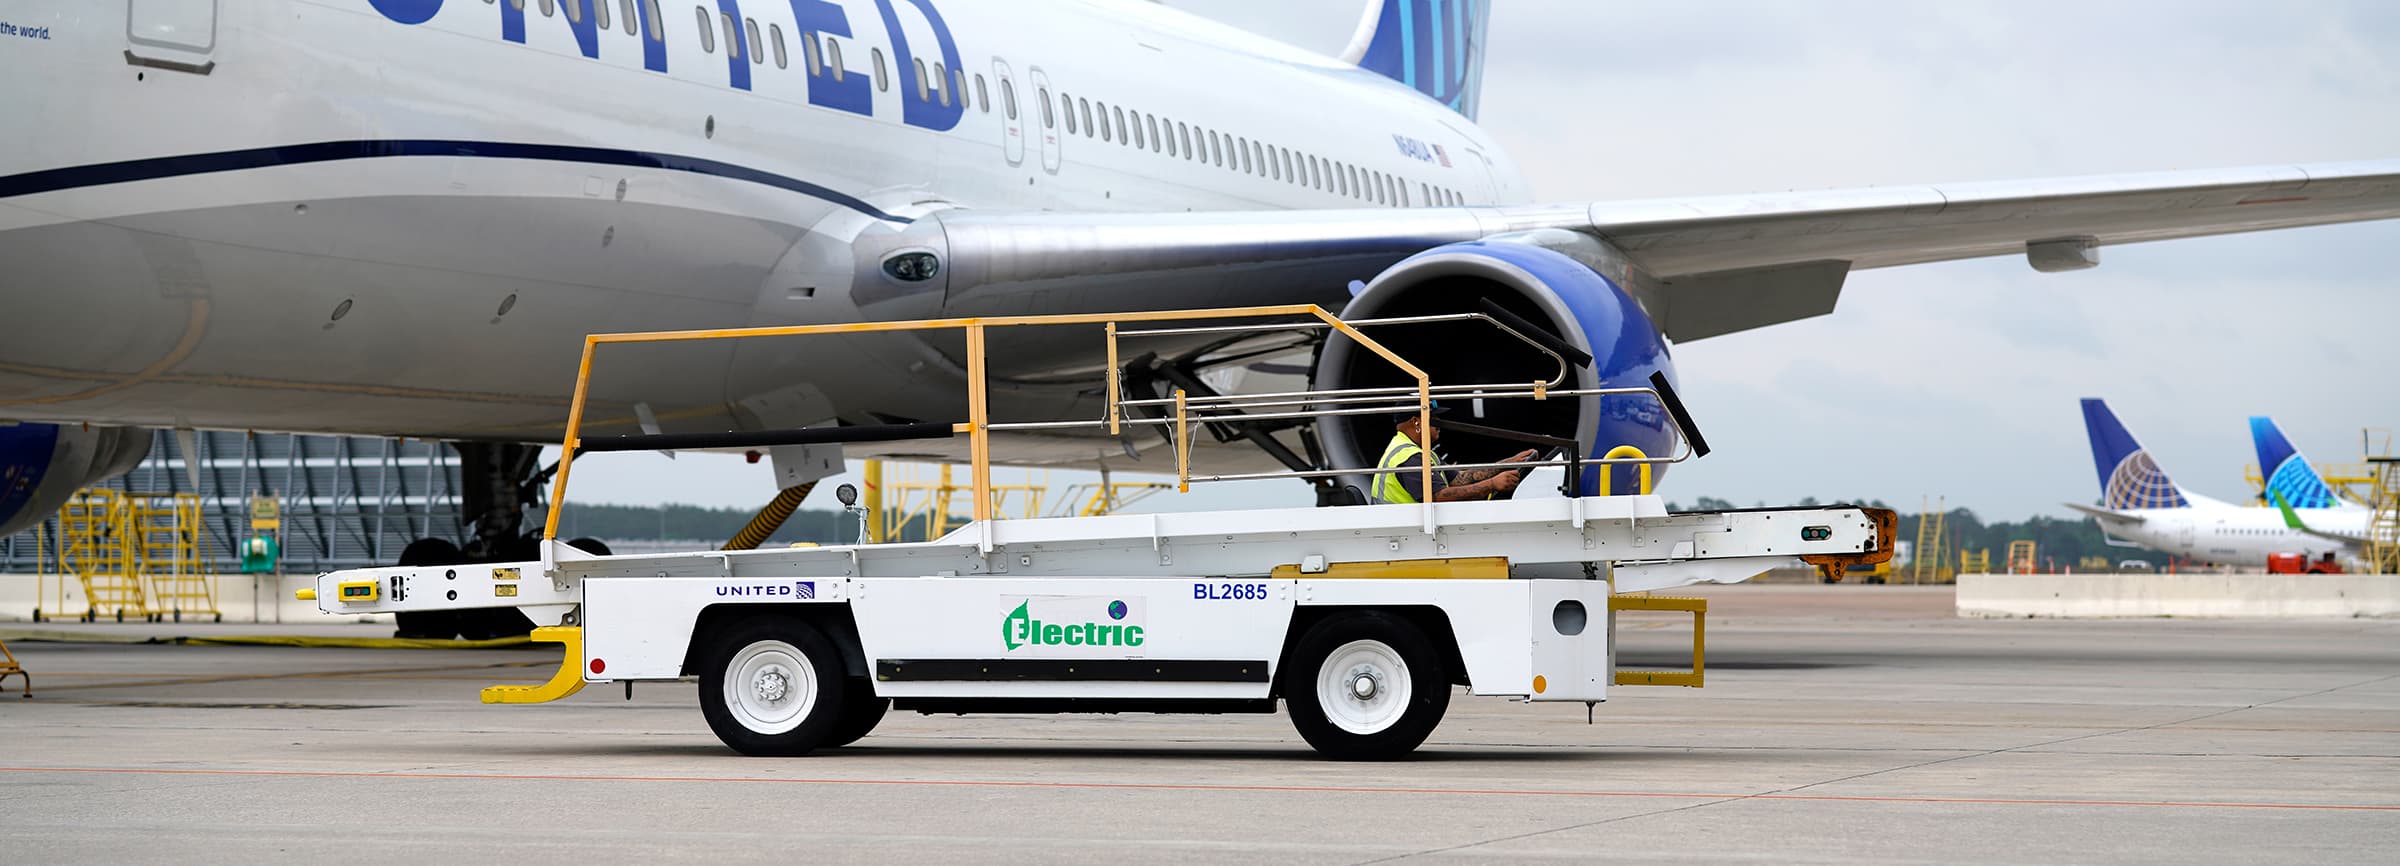
Operational measures that enable more efficient and direct flight can also reduce our GHG emissions. Some of these measures are within our operational control, such as opting for single-engine taxiing and reducing the use of the auxiliary power unit (APU) in favor of lower-emission solutions such as running on electric power at the gate. Additionally, we will rely on manufacturers to develop efficient technologies that we may be able to retrofit onto existing aircraft, improving fleetwide fuel efficiency up to 1.5% every five years.Footnote 13 Operational efficiency measures such as these are forecast to reduce emissions by 3.5% from a business-as-usual scenario in 2050.Footnote 14
In 2024, United established its Operational Efficiency Council to identify opportunities to reduce fuel usage across our operations. Progress continued in 2025, with increased use of single-engine taxi and reductions in APU runtime during standard operations compared to 2024. This was due to infrastructure enhancements, like installation of new electric fixed ground power and pre-conditioned air units, and developing scalable, data-backed improvement approaches at the airport level.
In 2026, the Operational Efficiency Council is expanding beyond its initial focus areas to pursue additional initiatives that drive systemwide fuel savings and operational improvements. Priorities include investing in improved tools, technology and data quality to enable data-driven decisions and policy changes that could help reduce fuel burn systemwide. The portfolio of these initiatives includes optimizing climb-out speeds, flight deck technology enhancements, potable water load optimization and efforts to reduce the fuel and downtime impacts of deferred maintenance.

The work of our Operational Efficiency Council demonstrates what’s possible when we bring our teams together with a shared goal. From our Dispatchers and Pilots to our colleagues in Airport Operations and Technical Operations, every group plays a vital role in making our flights more fuel efficient. Leveraging better data and regularly reviewing our processes across teams helps us continue to find new ways to save fuel, reduce costs and operate more efficiently.
Joe Heins, VP Network Operations and Operational Efficiency Council Executive Sponsor
1.1% - Alternate propulsion
We anticipate that zero-carbon aircraft technologies — such as battery, hybrid-electric or hydrogen propulsion — could potentially be adopted for shorter-haul flights by 2050. By using batteries powered by renewable energy, as well as green hydrogen propulsion, these aircraft have the potential to support lower-carbon aircraft operations for regional flights. Our illustrative decarbonization roadmap projects a 1.1% reduction relative to a business-as-usual scenario by 2050, driven by the potential adoption of alternative propulsion systems for short-haul aircraft. This is a decrease of 1.1% from last year’s projection due to changes in fleet composition.Footnote 15

Wedge chart showing adoption of sustainable aviation fuels (SAF)
- Today’s commercial SAF: [18.7]%
- 2nd generation SAF: [29.5]%
- 3rd generation SAF and carbon removals: [19.3]%
Click image to enlarge
Adopt more sustainable alternatives: Sustainable Aviation Fuel (SAF)Footnote 16
The vast majority of our GHG emissions stem from our fuel use. That is why it’s important to find and scale more sustainable alternatives than conventional jet fuel. Sustainable aviation fuel, or SAF, is an industry term used to describe an alternative to conventional jet fuel. On a lifecycle basis, SAF can emit up to 85% less GHG emissions than conventional jet fuel.Footnote 17 These reductions stem mainly from using renewable or waste-derived feedstocks, such as used cooking oil, instead of crude oil. While GHG emissions are still released during the collection, production, transport and combustion of SAF, total emissions across its lifecycle are lower than those of fossil-based alternatives.
Beyond lifecycle GHG emissions reductions, SAF provides the most scalable alternative energy source due to its role as a “drop-in” solution. Drop-in fuels are renewable or synthetic fuels identical, or nearly identical, to their conventional fossil counterparts. This means that, by blending with our existing conventional jet fuel supply, airlines can use SAF in their existing fuel supply infrastructure and aircraft without needing to make modifications. We are currently forecasting the various forms of SAF and carbon removals to contribute a total of 67.5% towards our net-zero goal, an increase of 2.2% from last year’s projection, due to reductions in opportunity size of other decarbonization levers.
Despite these potential benefits, the reality remains that SAF is currently in very scarce supply. SAF only makes up 0.7% of our overall fuel use and 0.6% of global airline fuel use. In order for SAF to make a meaningful contribution to our net-zero goal as we hope, the market for cost-effective SAF available to United will need to increase by billions of gallons, which is an immense challenge.
Learn more about SAFThis circular graph showcases our GHG emissions and carbon footprint in 2024. We had a:
- Total of 74% Direct (Scope 1) emissions
- Total of less than 1% of Indirect (Scope 2) emissions
- Total of 26% Other indirect (Scope 3) emissions
Click image to enlarge
18.7% - Today’s commercial SAF pathways
SAF available today at a commercial scale is currently sourced from limited global feedstock supply including residual fats, used cooking oils and greases, otherwise considered waste. Today’s SAF is produced in several ways, though primarily using known refining methods such as the hydro-processed esters and fatty acids (HEFA) process.
29.5% - 2nd generation SAF
There is potential that second generation of SAF conversion technologies could utilize existing and widely available bioproducts, like today’s ethanol, or convert types of biomasses made from sources like forestry waste, fuel crops, municipal solid waste and advanced alcohols into fuel. In addition to reducing GHG emissions, second generation SAF has the potential to strengthen America’s agriculture sector by providing farmers a new market by selling their feedstocks to SAF producers.
19.3% - 3rd generation SAF and carbon removals
Our illustrative roadmap assumes commercial availability of third generation SAF (sometimes referred to as power-to-liquids or e-fuels) in the late 2030s and 2040s. It is our hope that such advanced SAF will rely on carbon removals and green hydrogen feedstocks.
Footnotes
- Source: https://www.iata.org/en/youandiata/travelers/environment
- The data presented herein reflecting the United 2025 GHG emissions footprint has been internally validated by the Internal Audit Department of United Airlines and externally verified by our third-party verification party, Normec Verifavia. United obtains this third-party verification of our GHG emissions on an annual basis. Normec Verifavia conducts our emissions verification and provides an ISO 14064-3 limited assurance on our GHG emissions for reporting.
- The United complete target, as validated by the SBTi, states: “United Airlines commits to reduce scope 1, 2, and well-to-wake jet fuel GHG emissions, including scope 3 category 4, upstream transportation and distribution [from regional partner airlines], 50% per revenue ton kilometer (RTK) by 2035 from a 2019 base year. The target boundary includes biogenic emissions and removals from bioenergy feedstocks. Non-CO₂e effects, which may also contribute to aviation-induced warming, are not included in this target. United Airlines, Inc. commits to report publicly on its collaboration with stakeholders to improve understanding of opportunities to mitigate the non-CO₂e impacts of aviation annually over its target timeframe.”
- United’s emissions intensity increased by 0.3% in 2025 compared to the prior year despite a nearly 4.4% increase in revenue tonne-kilometers (RTKs), a measure of an airline’s operating capacity.
- The roadmap and forecasts depicted therein are based on our current or selected assumptions on relevant matters as of the publication date of this report, including currently available optimistic and medium- to best-case scenario net zero scenarios and pathways, as set forth in further detail below. The roadmap should be read with the context of each lever’s further description below, each of which is incorporated within the roadmap. The roadmap assumes emissions from Scopes 1, 2, and Scope 3, Categories 3 and 4, reflective of the United current GHG accounting methods. The roadmap does not include estimates of non-CO₂ effects of aviation, though it does include CH4 and N2O. These forecasts were not third-party validated and may change over time to reflect updated projections and assumptions and future conditions, events, and circumstances. United reserves the right to make additions, deletions or other revisions to this roadmap in the future, including changes to the relative weighting of various levers or the addition/deletion of certain levers, as it deems appropriate. The roadmap is based on various aviation net-zero scenarios, including the ATAG Waypoint 2050 Report, MPP Making Net Zero Aviation Possible Report, ICCT Vision 2050 Report, FAA Aviation Climate Action Plan and ICAO LTAG Report. The business-as-usual scenario incorporates both the United network plan estimates as well as current estimates of potential future growth based on U.S. GDP growth estimates from the Congressional Budget Office’s Long-Term Budget Outlook and Boeing. Not reflective of specific UAV portfolio companies, instead reflective of technologies generally accepted in industry and academic literature to be available in the stated timeframe. Excludes emissions from technologies included in UAV portfolio that would provide services outside of our current service offerings, such as supersonic travel and eVTOLs.
- Source: Boeing Fleet Renewal, https://www.boeing.com/sustainability#sustainable-aerospace
- Forecasted emissions reductions are calculated as the difference in emissions given estimated activity in 2050 when calculated with 2019 carbon intensity (on a per ASM basis) versus estimated carbon intensity of renewed fleet in 2050.
- Does not include estimates of specific aircraft technology currently under development but rather relies on estimates of both fleetwide intragenerational improvements, assuming a combination of technologies and intergenerational improvements to aircraft efficiency consistent with historic leaps in aircraft efficiency. A selection of potential and illustrative technologies is included in ATAG’s Waypoint 2050 report, beginning page 30: Waypoint2050-digital-29012026.pdf
- Source: 2021 United States Aviation Climate Action Plan (faa.gov)
- Source: ATAG’s Waypoint 2050 Report, Ed. 2, Sept. 2021, p. 42
- United has modeled that, when combined, the assumed fleetwide intragenerational improvements and technologies available to retrofit to improve fuel efficiency could reduce the total size of the United business-as-usual emissions footprint by 7.5% by 2050.
- Source: United Invests in Next Generation Blended Wing Aircraft Start-Up JetZero
- The hypothetical emissions reductions from operational efficiency improvements reflected in the illustrative decarbonization roadmap reflect measures that can be taken today by both aircraft operators (such as aircraft weight reduction measures) and air traffic management (such as continuous descent and climb and surface congestion management). However, the forecasted emissions reductions do not reflect the potential of advanced, next-generation concepts, like Trajectory-Based Operations or formation flying.
- Based on internal modeling of theoretical fleetwide mid-point average for fuel efficiency opportunities.
- According to Mission Possible Partnership’s 2022 ”Making Net-Zero Aviation Possible” report, alternate propulsion aircraft capable of the size and range requirements of our regional fleet may be available beginning in the 2030s and at scale by 2050.
- Based on internal United estimates of future SAF uptake, representative of the volumes of SAF required to reach the United 2035 goal. Projected global SAF volumes based on an average of the ATAG Waypoint 2050 and ICAO LTAG report scenarios with medium attainability. In 2050, the combustion of SAF will still result in GHG emissions from the aircraft engine. These levers assume available GHG accounting methodologies will recognize upstream emissions reductions from SAF, thus netting out any emissions from combusting SAF when considering SAF emissions on a lifecycle basis.
- SAF used by United has up to 85% lower GHG emissions than regular jet fuel when we count all its emissions, all the way from how it’s made and delivered to the airport, to when we use it (these are called ‘lifecycle emissions’). However, this does not mean our current use of SAF reduces our carbon footprint by 85%.